Per Serving or Per 100 Grams: Which Comparison Fits?
Per serving or per 100 grams comparisons help you judge similar foods fairly, account for the portion you plan to eat, and avoid mismatched label numbers.
Per serving or per 100 grams comparisons answer different questions: one describes a labeled portion, while the other puts foods on an equal-weight basis. If two packages list different serving sizes, comparing their per-100-gram figures can help you see how their nutrition differs for the same amount of food.
Match the question
Use the serving column when you want to understand what a stated portion contributes to a meal. Use per 100 grams when you want to compare the composition of similar foods without letting each package set its own portion size.
A serving is a declared amount, not necessarily the amount you eat. Per 100 grams uses a fixed weight, so it can make two labels easier to compare even when their stated servings differ.
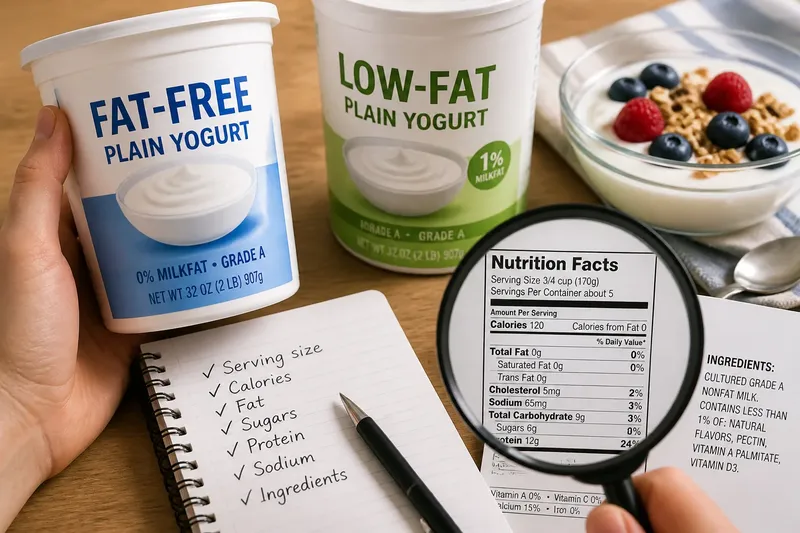
For two tubs of plain yogurt that you eat in similar bowls, serving figures may be convenient if the serving amounts are alike. If one label calls a small scoop a serving and the other lists a larger bowl, per 100 grams gives a more consistent comparison.
Per 100 grams comparisons
Before reading the numbers, check that the products and their preparation are comparable. Plain oats and sweetened oat cereal are different products; dry pasta and cooked pasta also describe different states. Look for whether the panel refers to food as sold or as prepared.
- Equal food weight: compare per 100 grams on both labels.
- Your usual portion: compare serving figures if the serving weights are alike; otherwise, adjust them to the same weight.
- A recipe or meal: use the amount you plan to add rather than assuming the package serving matches your use.
- Drinks and pourable foods: check for values per 100 milliliters. Compare the same units unless you have a reliable conversion for that product.
Then choose a row that fits your question, such as fiber, sodium, or added sugars. Check the nutrient name on both panels: total sugars and added sugars are not interchangeable measures.
Read the panel carefully
Find the serving amount, its unit, and any per-100-gram or per-100-milliliter column. Compare the same nutrient on both products and use the same basis. A serving value on one label cannot be compared directly with a per-100-gram value on another because the figures describe different amounts.
If only one package provides a per-100-gram column, check whether the serving weights are printed and comparable. When they are not, the labels may not support a fair numerical comparison; looking for products with clearer, comparable panels is more useful than guessing.
Adjust to your portion
If you know the weight you plan to eat, you can scale a per-100-gram figure to that amount. Multiply the listed value by your portion weight, then divide by 100, keeping the units consistent. A kitchen scale can help with cereal, cheese, or nuts, but you do not need to weigh every snack.
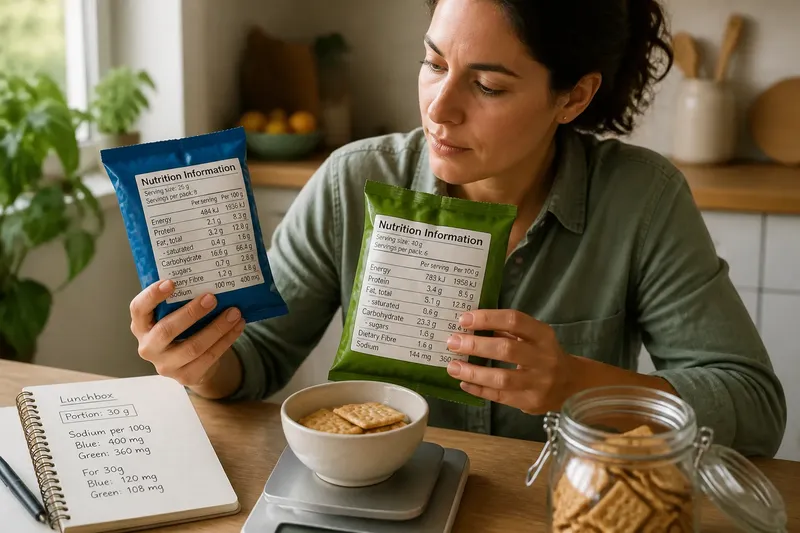
Say you are choosing between two bags of crackers for a lunchbox. Imagine the first label lists a 25-gram serving and 400 milligrams of sodium per 100 grams, while the second lists a 40-gram serving and 360 milligrams per 100 grams; these are invented values for illustration. First, compare the shared per-100-gram basis: the second product has the lower listed sodium for an equal weight. If you plan to pack 30 grams, scale each figure: the first comes to about 120 milligrams and the second to about 108 milligrams. The second remains lower for that portion, though the arithmetic does not tell you which crackers you will prefer or what else matters to your choice.
Which basis fits best?
Which basis helps compare similar products?
Per 100 grams is often clearer when serving sizes differ, because it holds food weight constant. Serving figures are useful when the portions are alike or when you want to understand a familiar serving.
Can I compare different serving sizes directly?
You can read both values, but a larger serving may naturally have a larger nutrient amount. Compare per 100 grams or adjust both figures to the same portion weight.
What if one label lacks a per-100-gram column?
Check whether both serving weights are printed and comparable. If not, treat the figures as insufficient for a fair numerical comparison rather than guessing at a conversion.
Should I compare calories or nutrients first?
Start with the energy value or nutrient tied to your reason for comparing. Then consider other relevant parts of the panel, since one row cannot describe the whole food.
Keep effort in proportion
Choose a small number of relevant rows instead of trying to rank every nutrient. For cereal, you might compare fiber and added sugars per 100 grams, then consider how much you actually pour. For soup you eat by the bowl, serving values may be more useful if the listed portion resembles your bowl.
It is not worth converting every label into elaborate calculations when the foods differ in kind or use. Equal-weight numbers do not tell you about taste, texture, ingredients, or how a food fits your meal; they only make the selected nutrition figures comparable.
For a useful per serving or per 100 grams comparison, match the product type and units, then decide whether you care about equal weight or your own portion. That small choice makes the numbers easier to interpret without asking one column to settle every food decision.